Lesson 2.
Learning to know your Facebook SDK
Facebook SDK is already integrated into your OnDe powered system. At the very moment your app goes live, Facebook will start gathering all the data relevant to your business.
Facebook SDK settings
In the left part of your Facebook Analytics panel, you will see the menu to navigate through the metrics. What kinds of data is there?
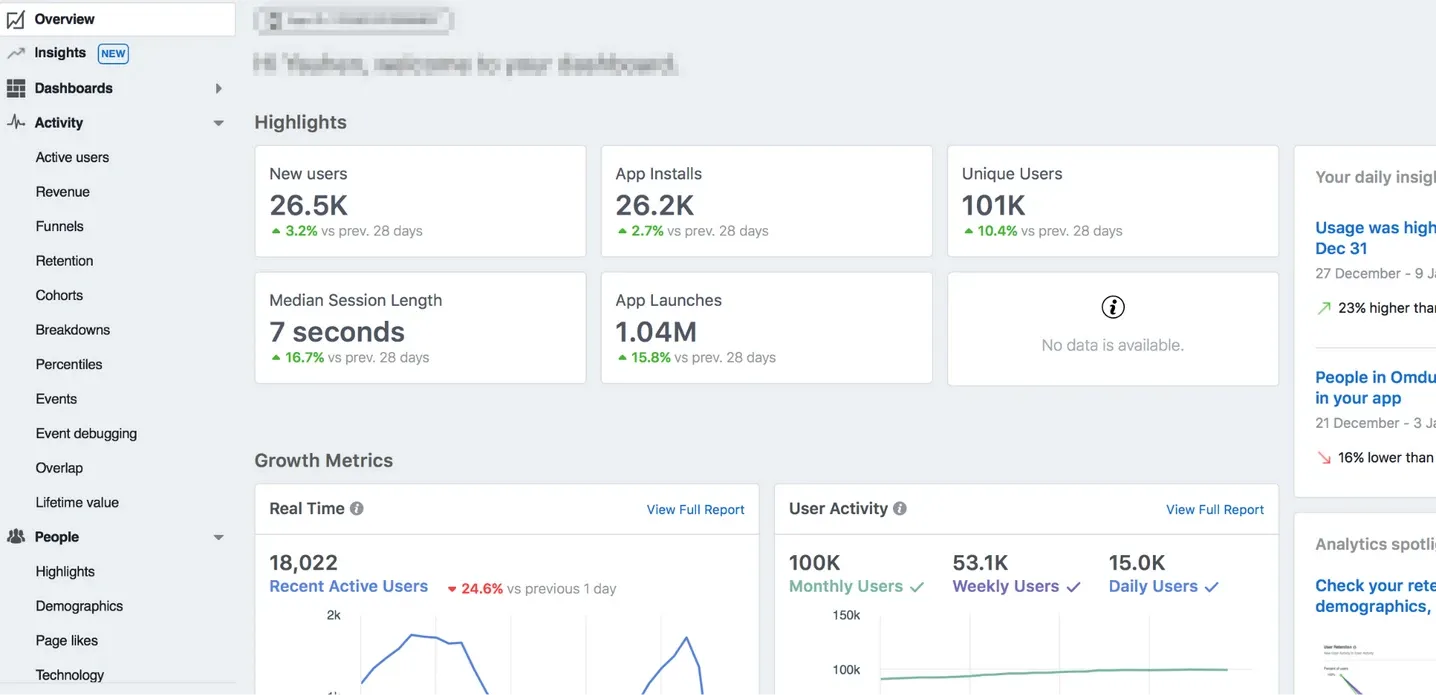
“Overview” is the general information about how your app is being used. Here, you see all the most important data, visualized. “Overview” tab gives you quick access to the fresh statistics.
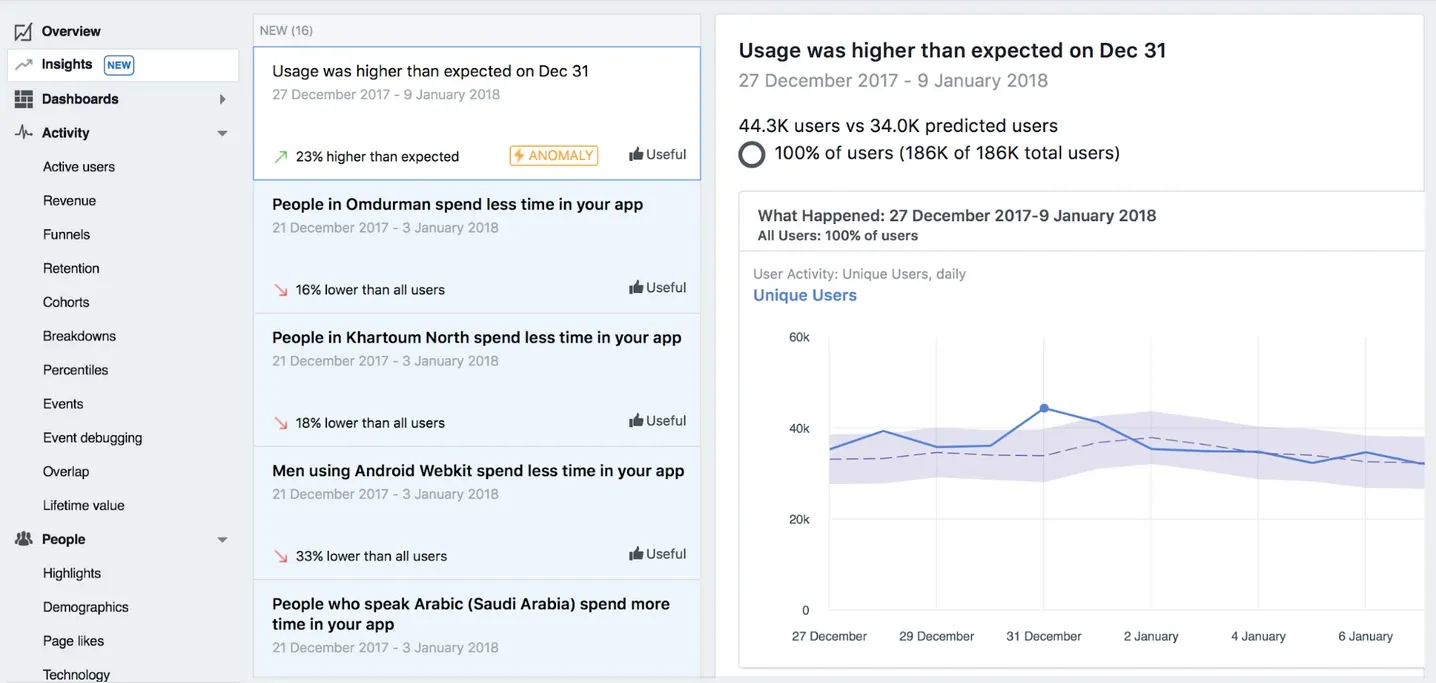
“Insights” is an automated analysis of the stats on your apps. Facebook SDK tries to give you some tips on business development as based on the data the system gathers. This is a useful tool for when you don’t have the time or human resources to carry out deep analysis of your app performance.
The next tab is “Activity”. Here you see all the things people do with and within your apps. Every button of the “Activity” menu gives you a lot of numbers about how the apps are doing. Let’s see what’s there!
The “Active users” tab name speaks for itself: it has all the reports about your active users. Numbers on their activity, sessions, age, and gender are stored in this tab.
“Retention” tab shows how many people come back to your app, in other words, use it repeatedly. Say, an initial interaction for your app is an app install. Retention (shown in daily, weekly and monthly intervals on Facebook Analytics for apps) shows how large the percentage of people getting back to your app is.
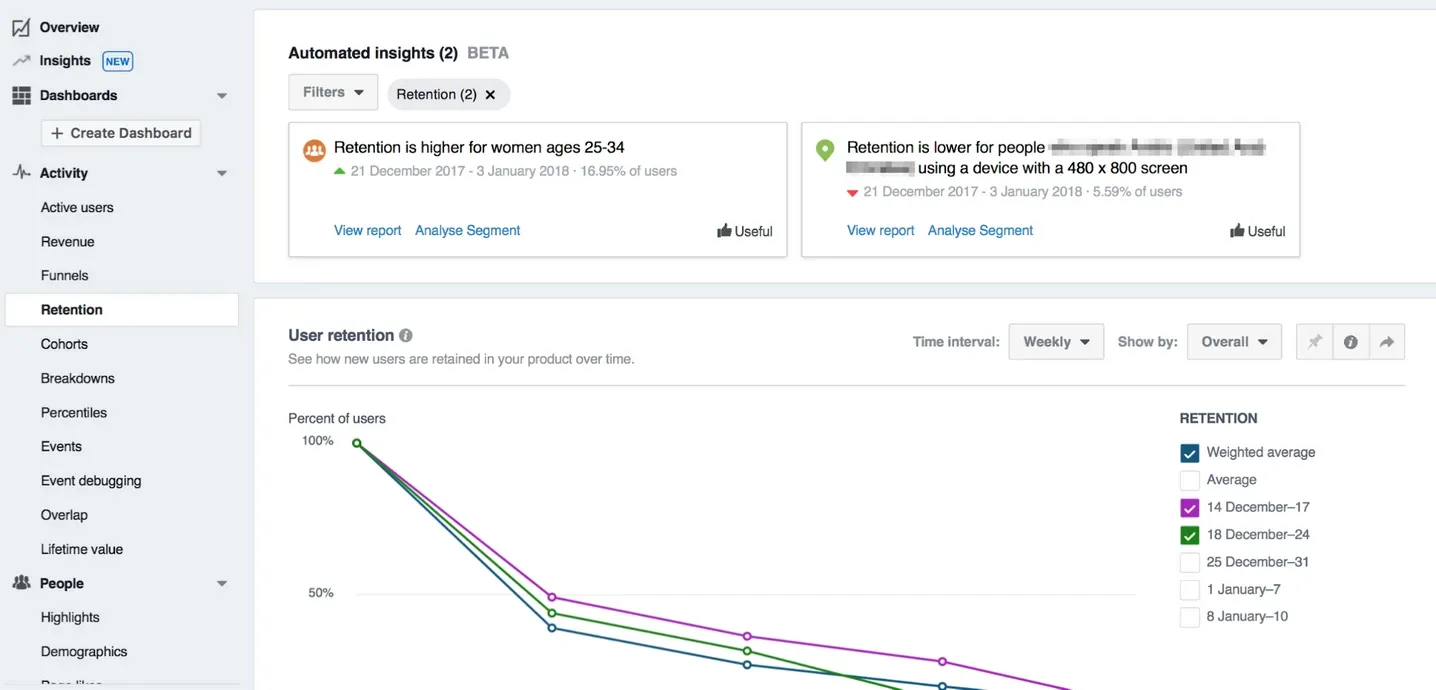
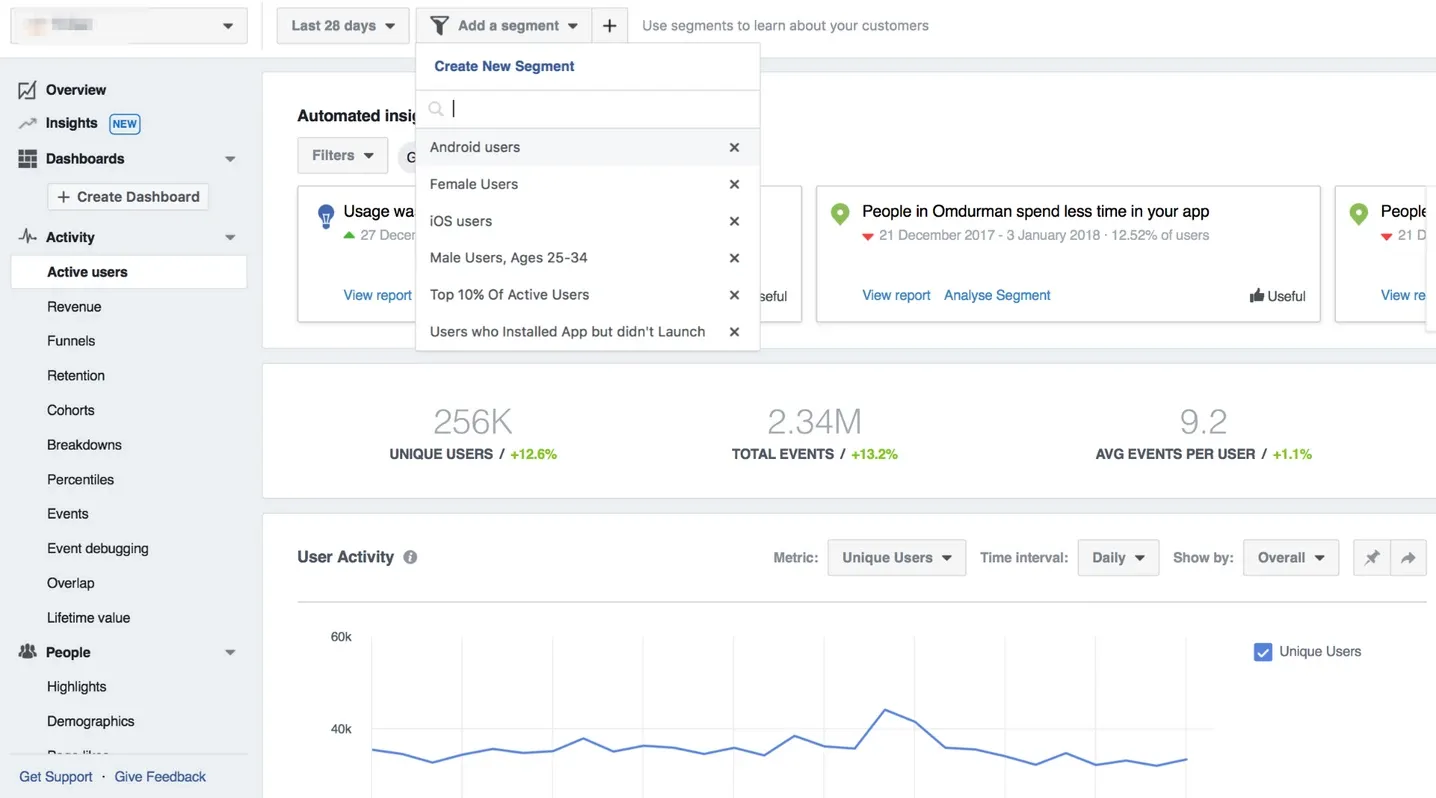
You can segment this data to see if the retention percentage varies for different audiences — just apply “Segments” option:
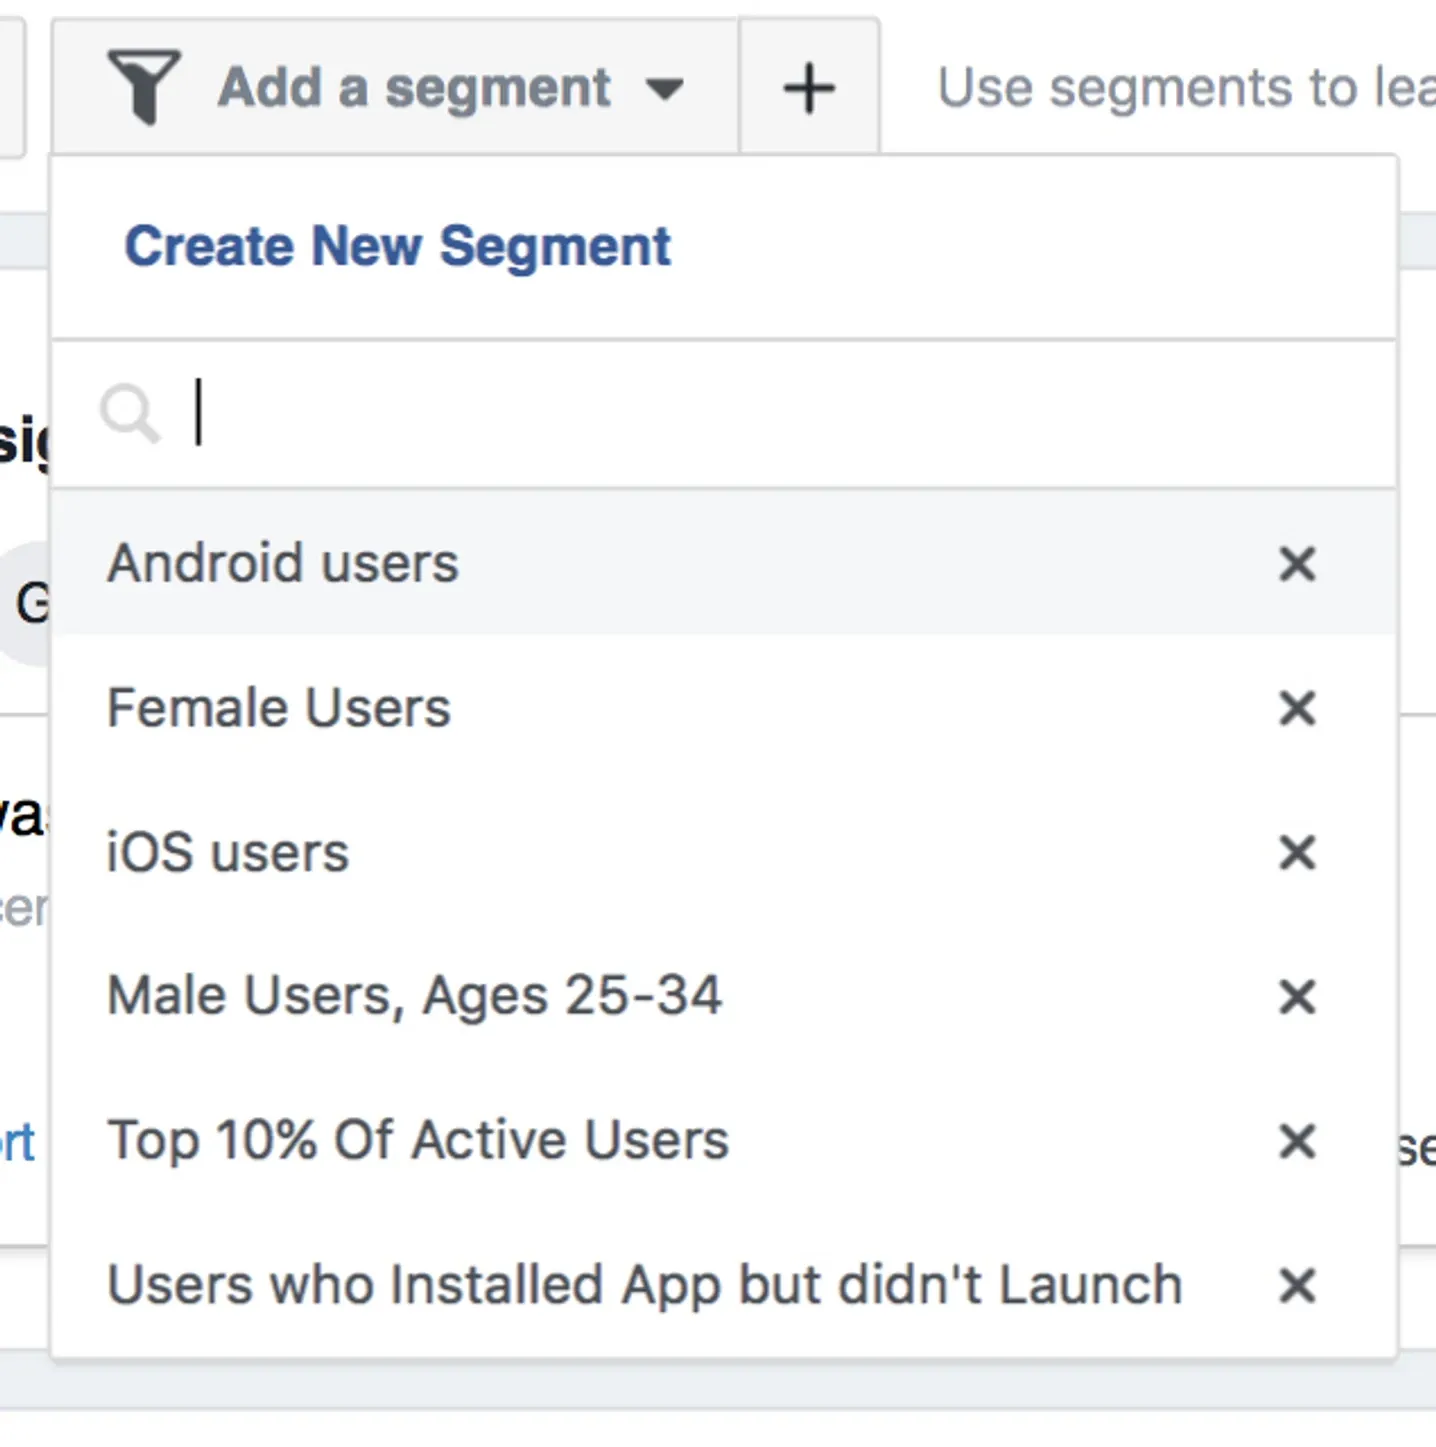
Segmentation is available for almost every page of Facebook Analytics. You can segment to understand how specific groups of people are interacting with your product:
- People using a particular version of an OS;
- People with older versions of your app;
- People of a certain age;
- People speaking a specific language or coming from a certain region, and so much more!
You set the segments yourself. Change and delete them over time, which ensures you get information about the most relevant groups of people.
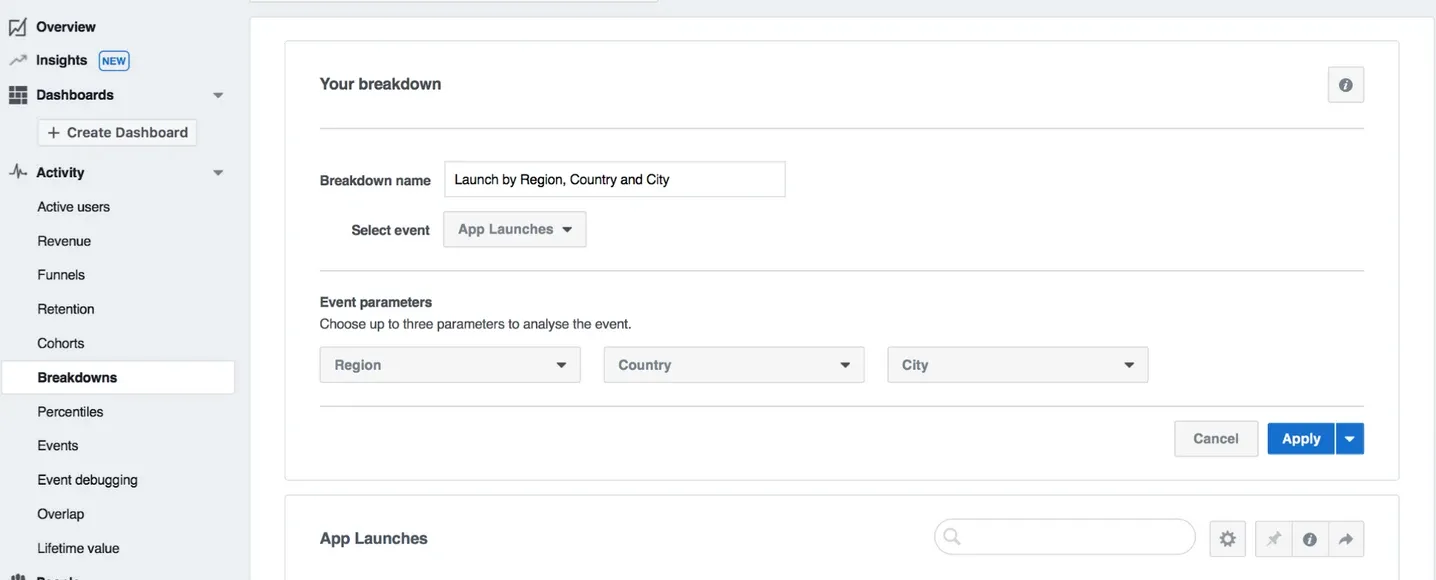
The “Breakdowns” tab is showing a pivot table of all the statistics Facebook Analytics collects about the app. It enables you to group the data by all kinds of criteria: region, event type, app install source. And, guess what, you can apply segments to it!
The “Events” tab has all the information about the app events — things customers do within your app that are significant for your business development.
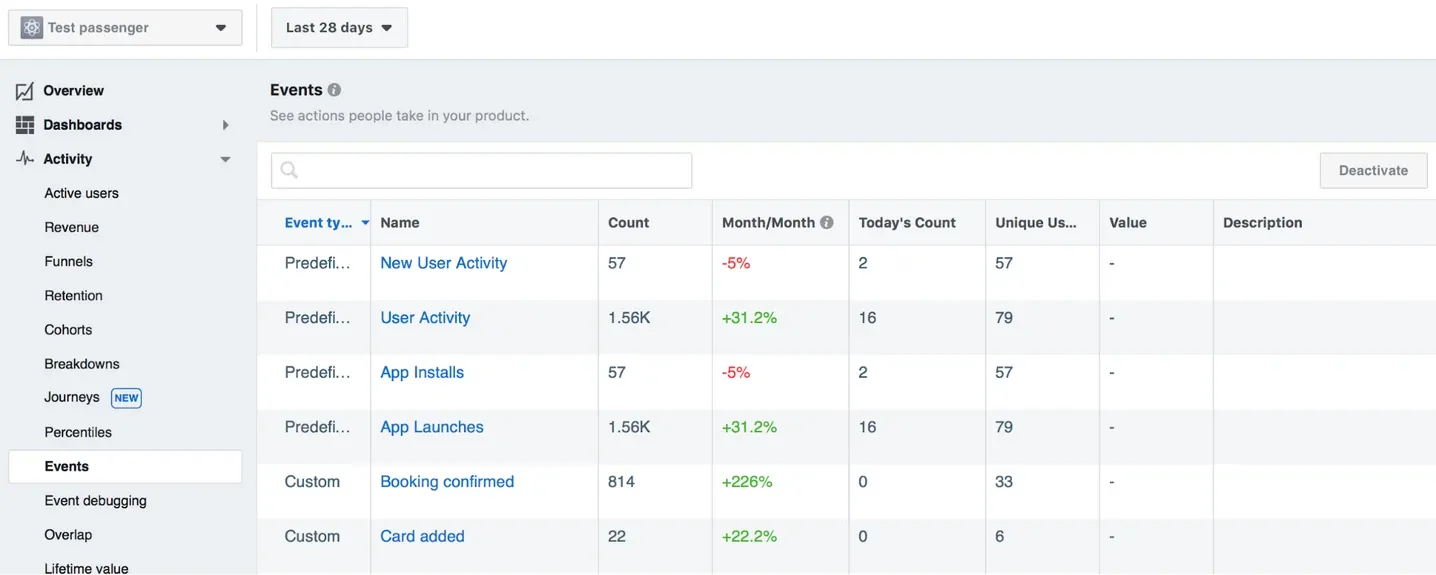
There are various kinds of events possible in apps:
- App install — every time a user installs the app;
- App launch — every time a user opens the app on the smartphone;
- Sign up for the app — every time a user gets registered in the app;
- Booking confirmed — every time a user books the services;
- Order cancelled — every time a user cancels an order;
- Trip paid — every time a user proceeds a payment for an order;
- Card added — every time a user ties up a credit card to an account;
- Order rated — every time a user rates an order.
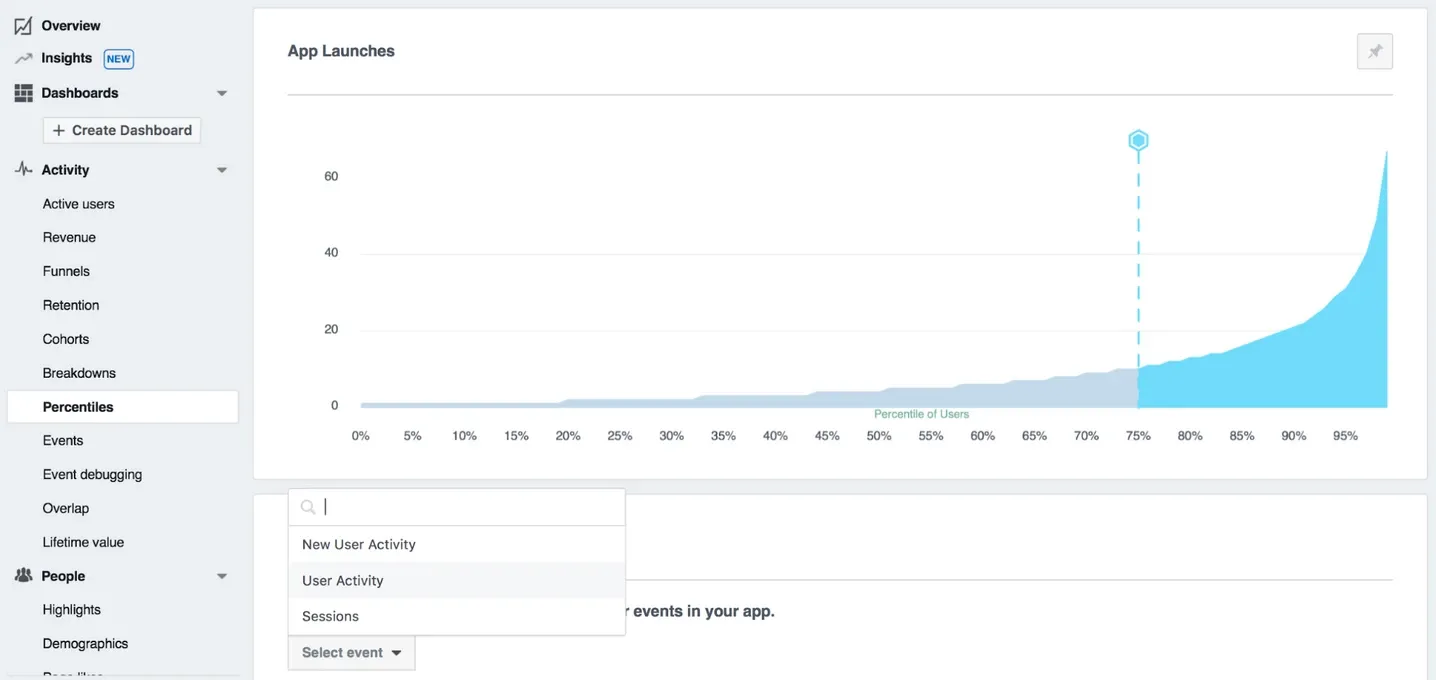
App installs and app launches are key performance metrics for you to get an increase in your app downloads. These events are basic for Facebook Analytics integrated with the OnDe apps. “Percentiles” tab illustrates how the people who’ve launched your app are distributed. The x-axis shows the percentile of clients, while the y-axis — the number of app launches. If you move the pointer along the x-axis, you will see how many percents of users have launched your app a certain number of times. You can custom percentiles based on other app events.
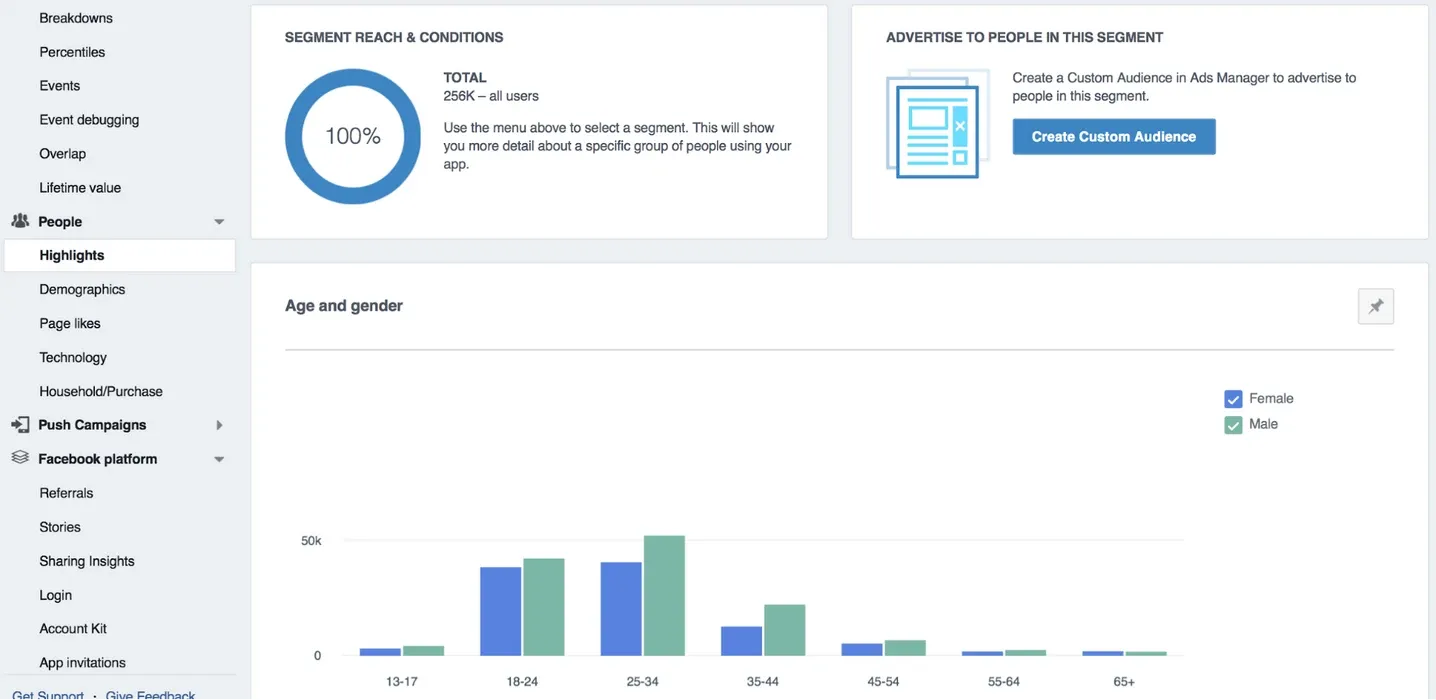
Now, let’s move to the “People” tab! “Highlights” is a complete representation of everything Facebook SDK knows about your audience. Based on this data, you can create a Custom Audience on Facebook to advertise your app to.
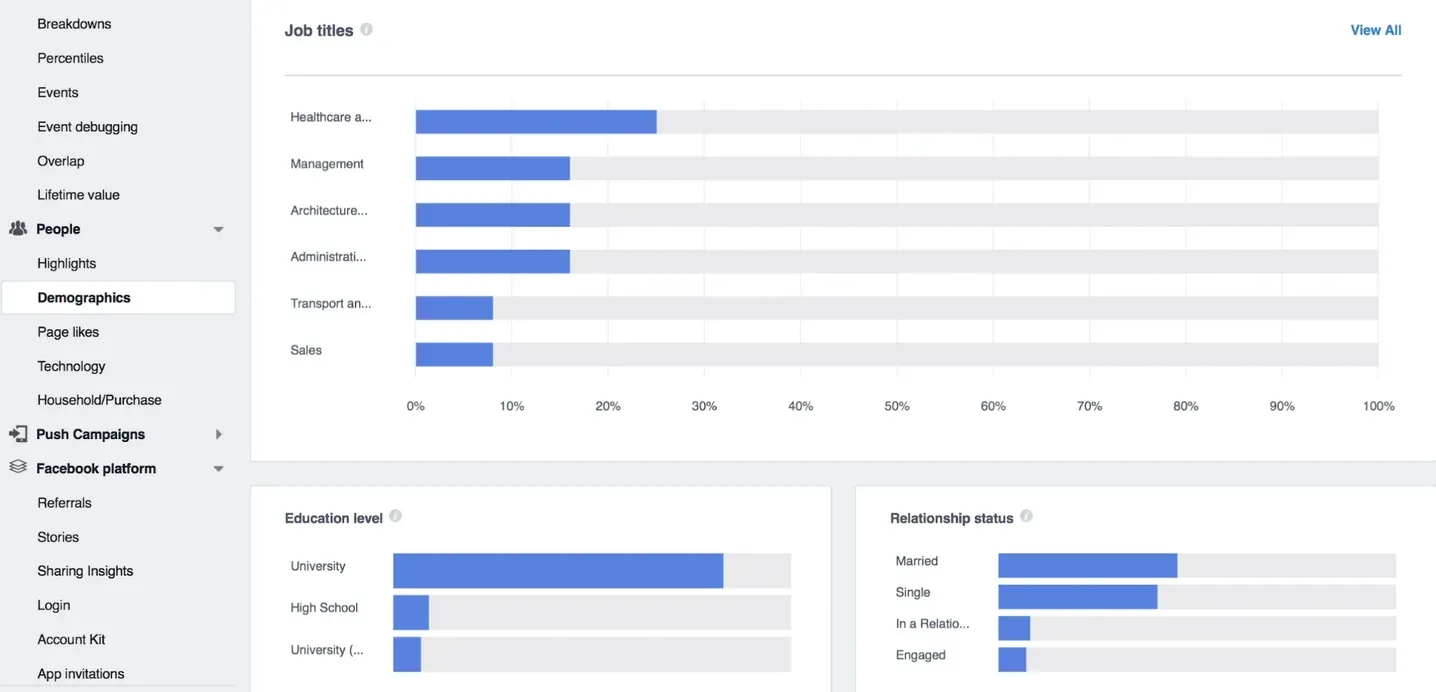
“Demographics” tab shows you some more specified characteristics of the audience: their level of education, relationship status, job status.
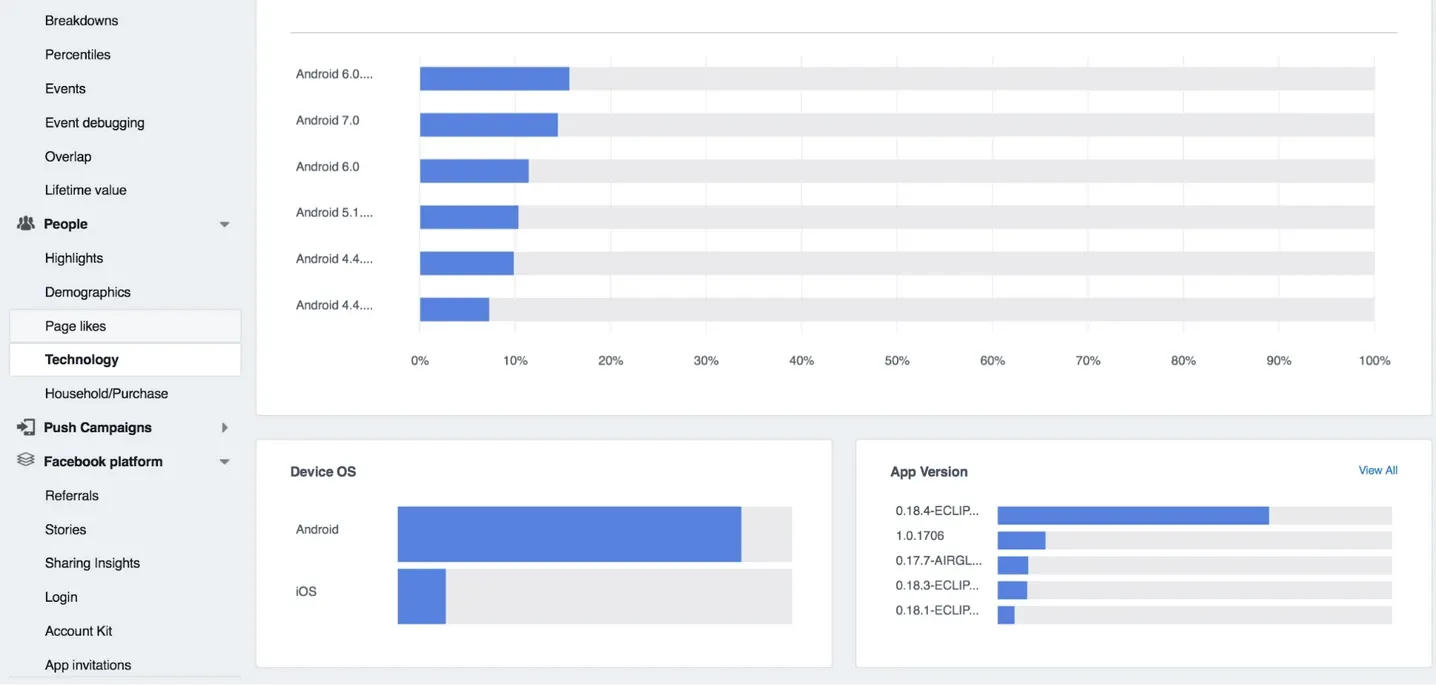
“Technology” tab provides you with insights on what devices people use to interact with your app. Again, this tab helps a lot to understand who your audience is.
Now you’ve seen all the metrics, you’re probably wondering: what to do with all the data Facebook SDK is drawing on my customers? No worries! We’re going to explore your options in the next lesson!
