Google Ads and Google Analytics
Now that we’ve discussed acquisition and app installs, time to talk about using Google Analytics to maximize your Google Ads campaigns.
Google Ads, and particularly Google App campaigns, is a great source of new users. It’s very low-cost, and the tool literally does everything for you: it automates your ads so that you get more installs. However, you get the best results when you connect your Google Ads and Google Analytics. So how to do that?
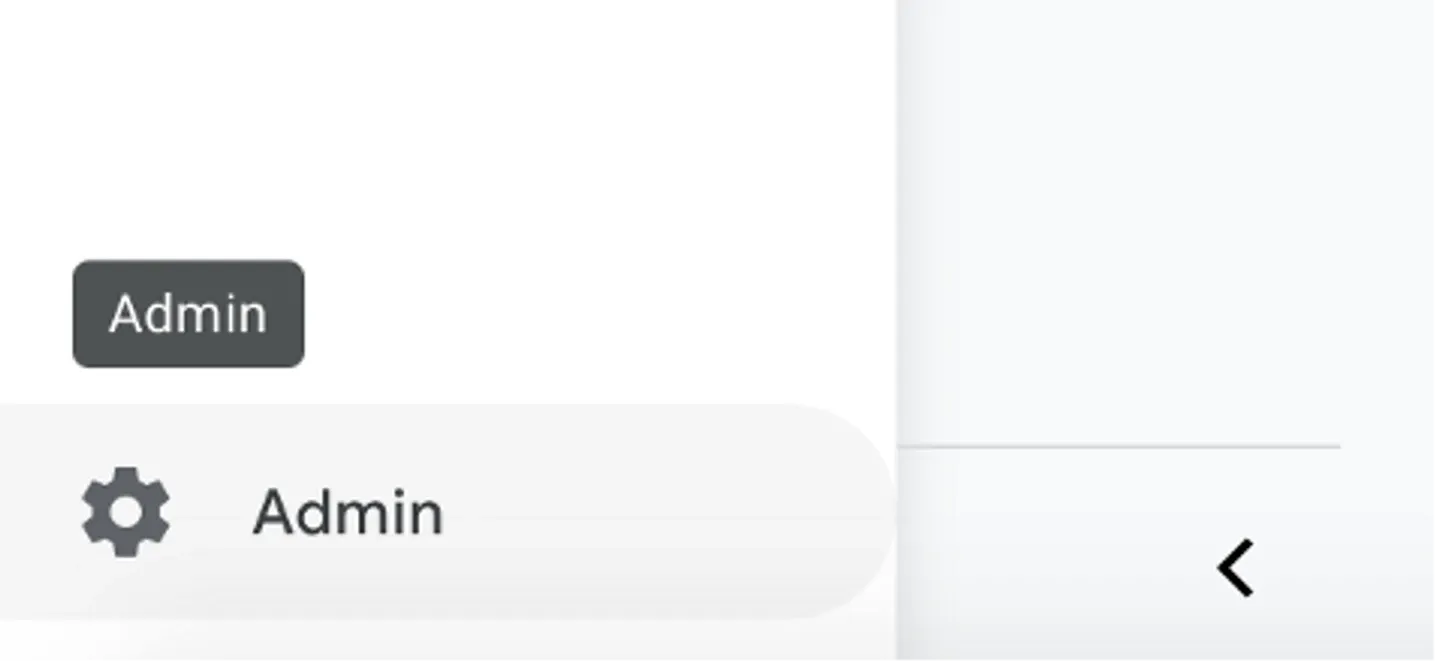
First, go to your admin page (bottom left corner of the Google Analytics page).
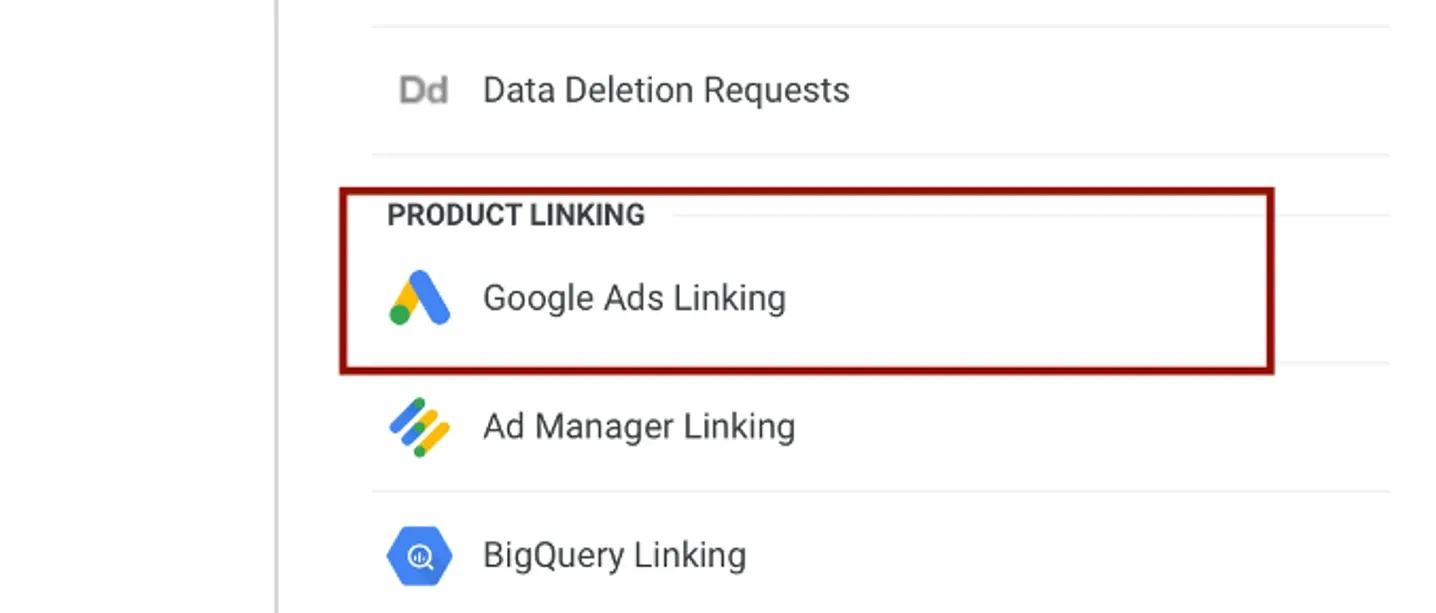
Now, find the section called Product Linking. It’s under the Property tab. Choose Google Ads Linking:
The page will show the list of accounts linked to your Google Analytics account.
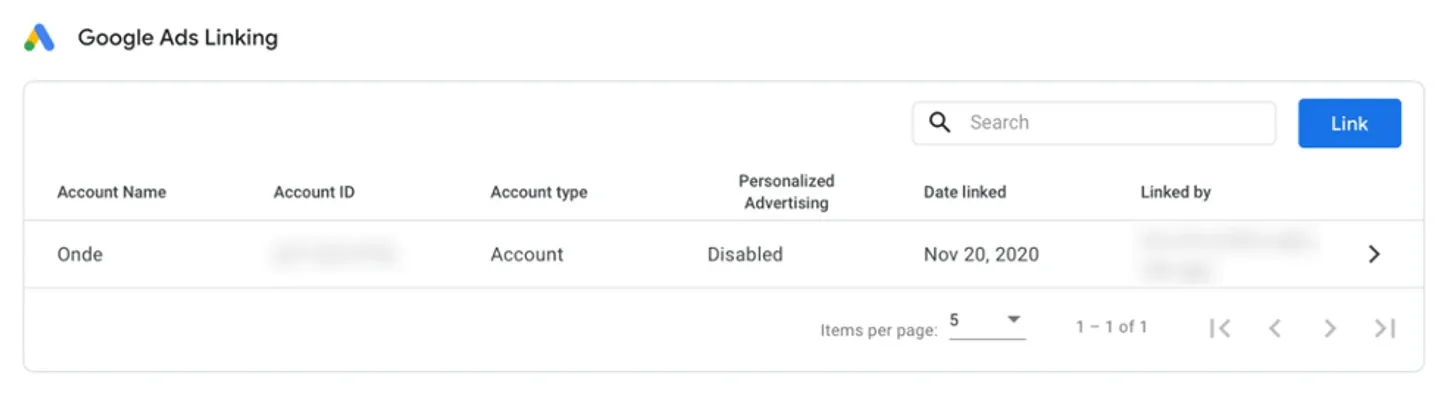
To add a new account, press the Link button. You will see a popup offering to connect your Google Analytics to the Google Ads account you manage.
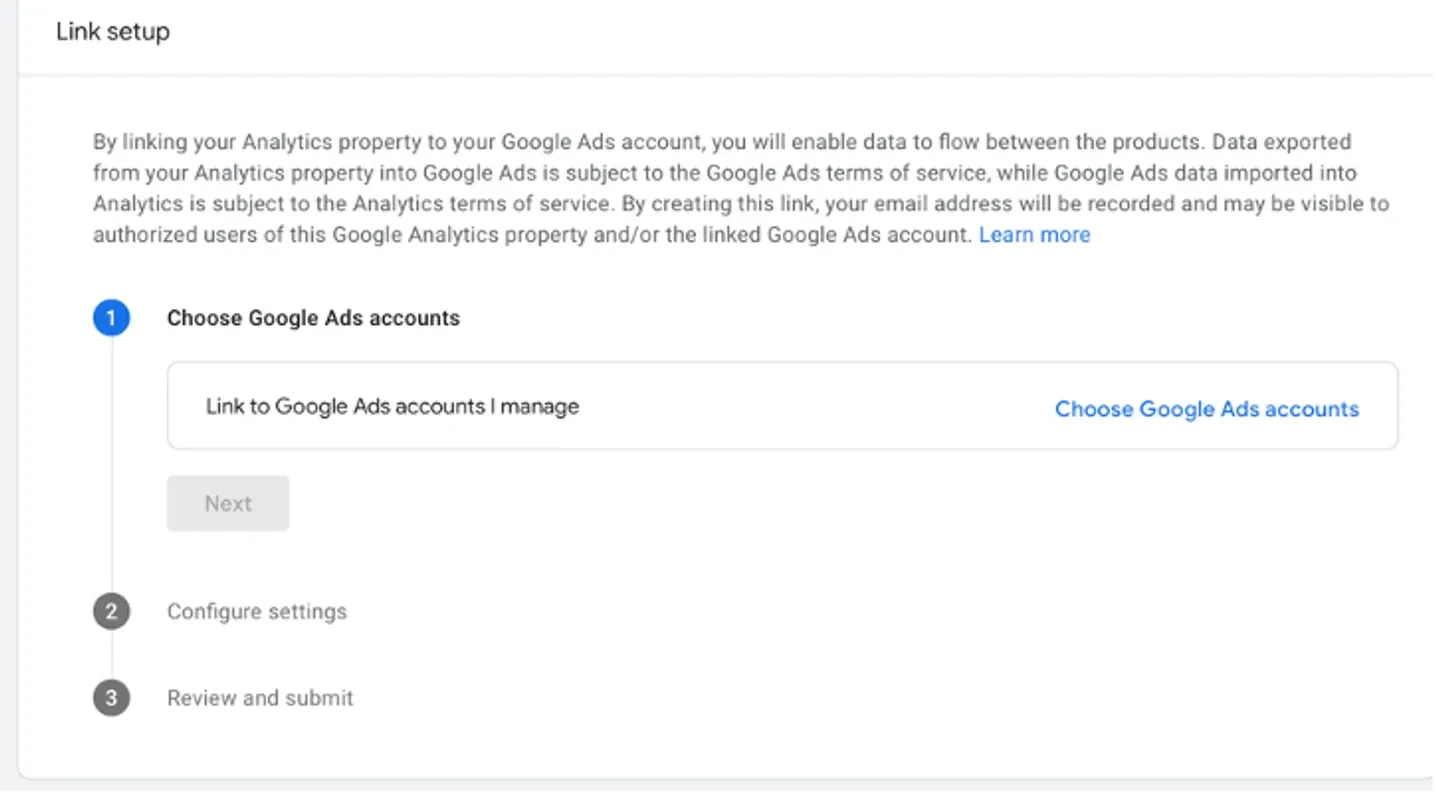
After choosing an account to connect, tap Next and go to the next section, where you will be asked to enable personalized advertising. Enable it to use different audience lists and launch remarketing campaigns.
We also suggest you enable auto-tagging. Auto-tagging helps advertise your app more efficiently by showing the ads to users interested in your services. It also provides you with more advertising options for well-personalized campaigns.
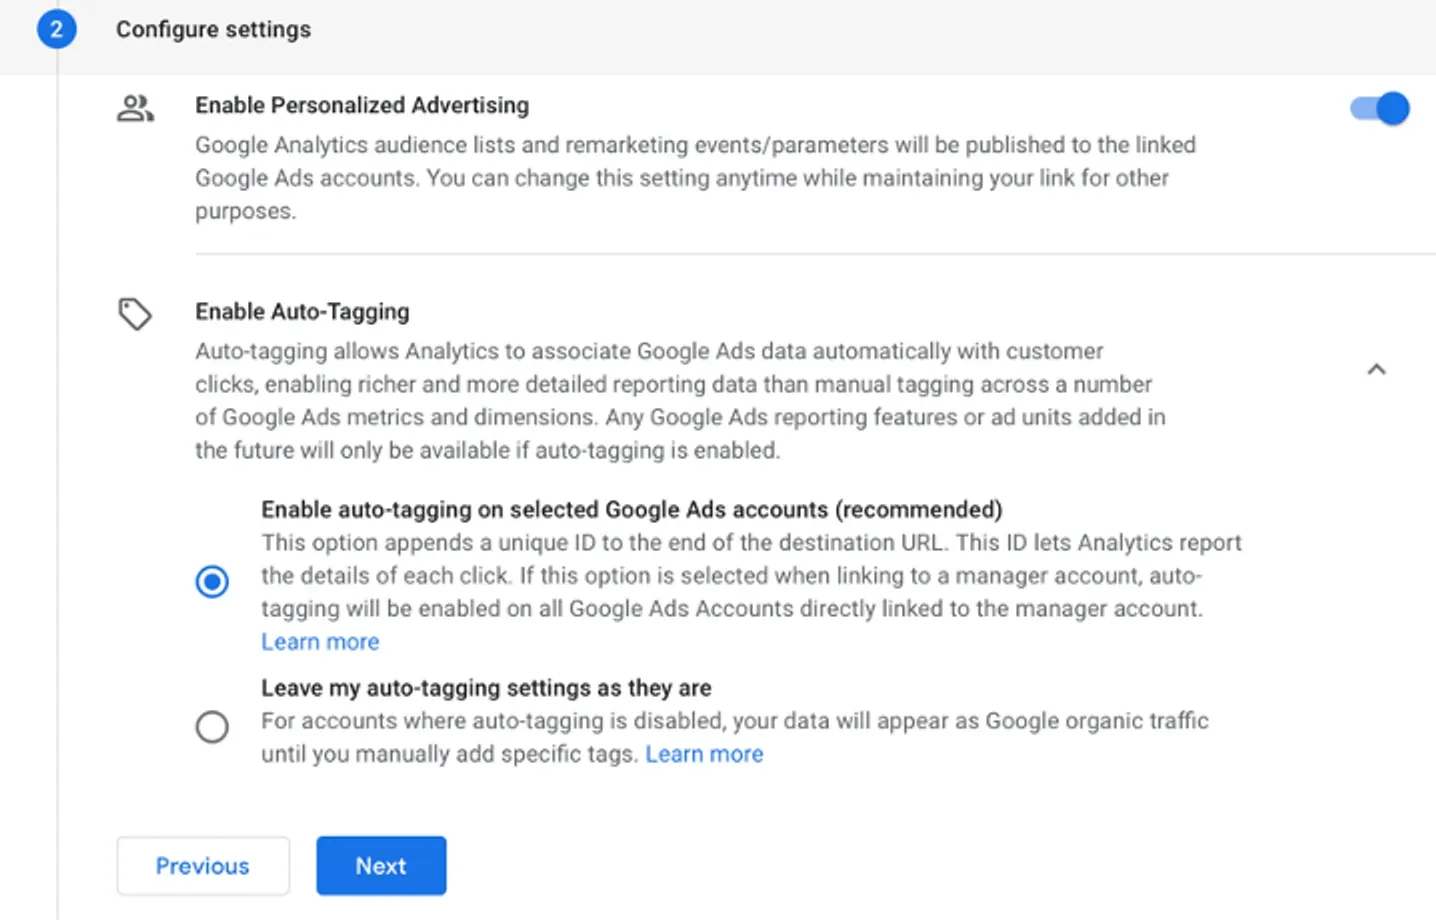
Now, click Next, review all the changes made, and submit them. Enjoy your better-targeted advertising!
After you connect your Google Ads with Google Analytics, it’s time to start tracking your advertising directly in Analytics. Where do you find them?
Go to Acquisition, then choose Acquisition overview, and at the bottom of the page, there’ll be a graph Sessions by Session campaign. Click on the View Google Ads campaign button and enjoy your statistics.
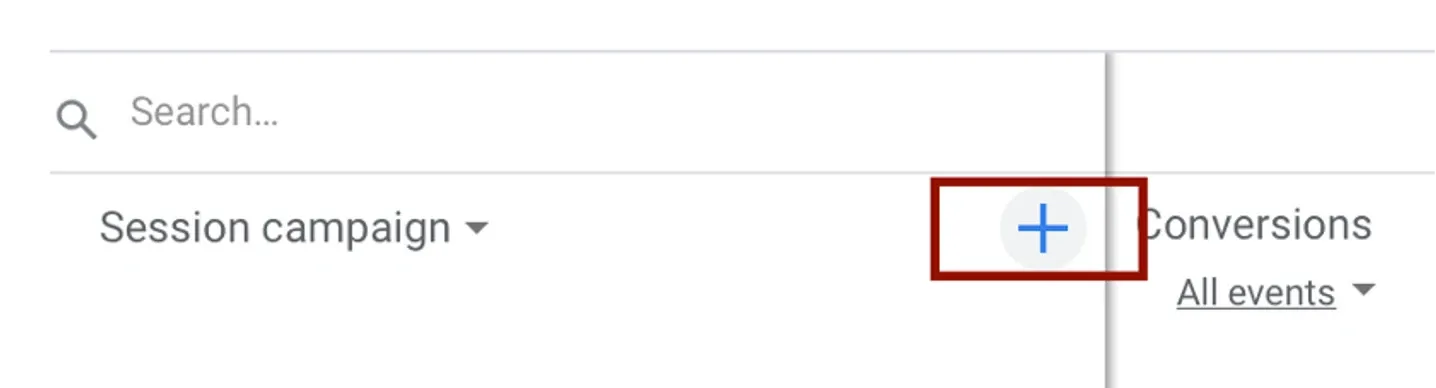
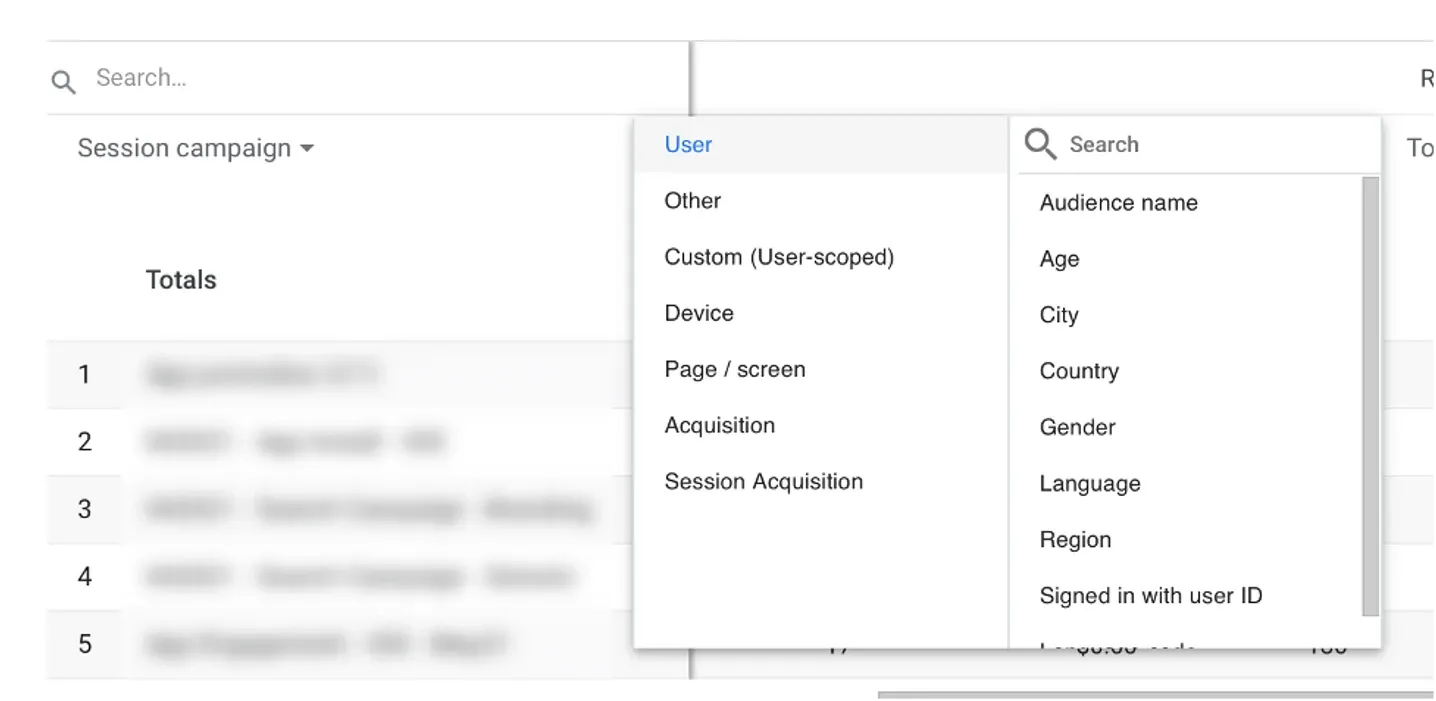
Fancy seeing more dimensions? Just press the + sign and choose any parameter you would like to see.
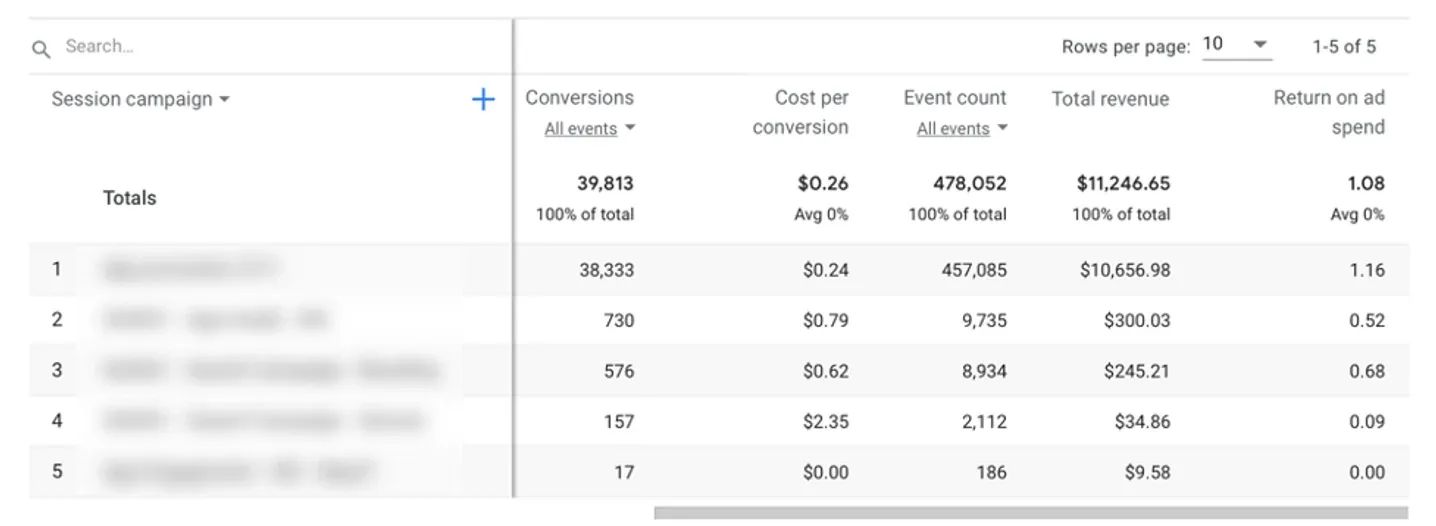
What should you consider when you look at the statistics of your Google Ads campaigns? First of all, conversions. By default, statistics show all conversion events, but you can easily choose which one of them you would like to see.
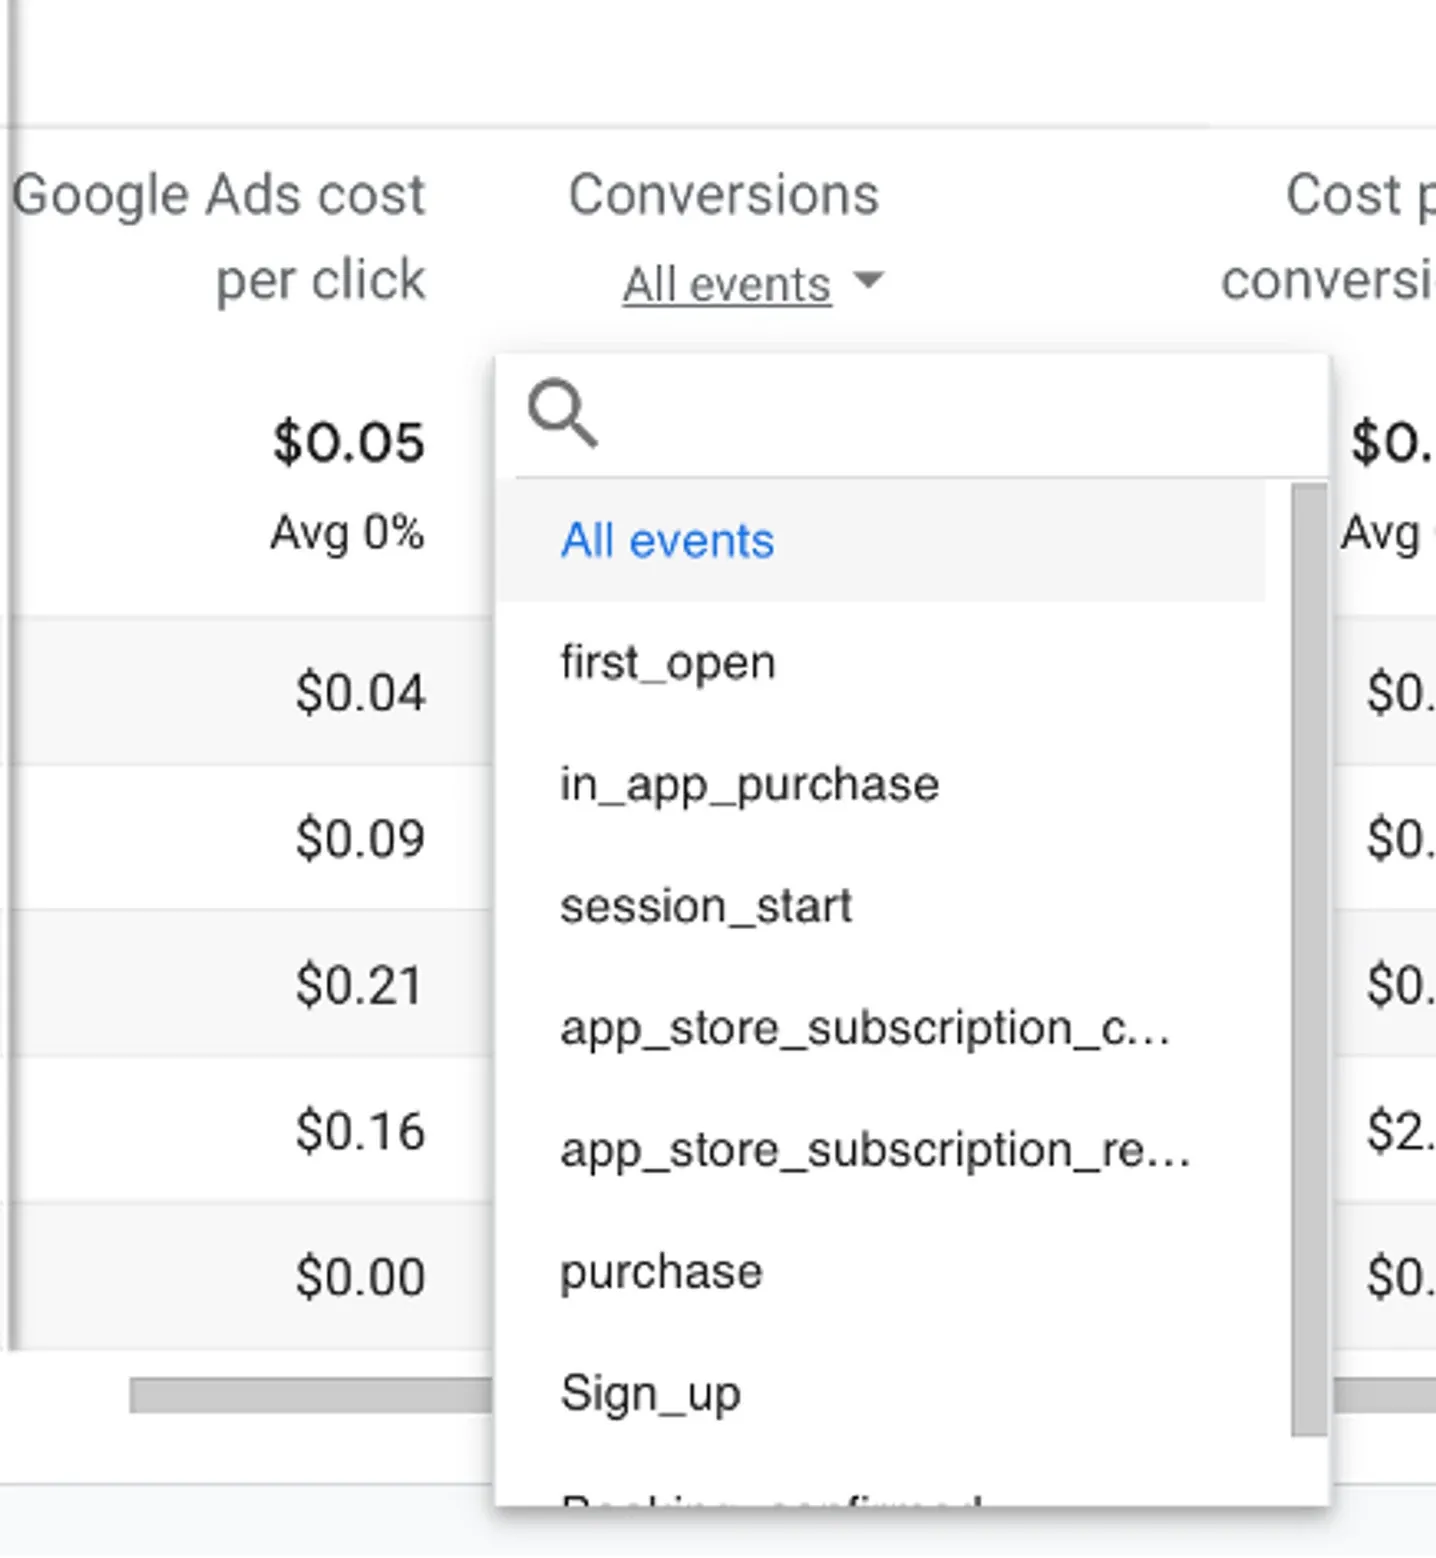
Another metric to look at is the Cost per conversion. It tells how much money you spent on one user event. If your “first open” is more expensive than one trip, you need to change your digital strategy and stop wasting money.
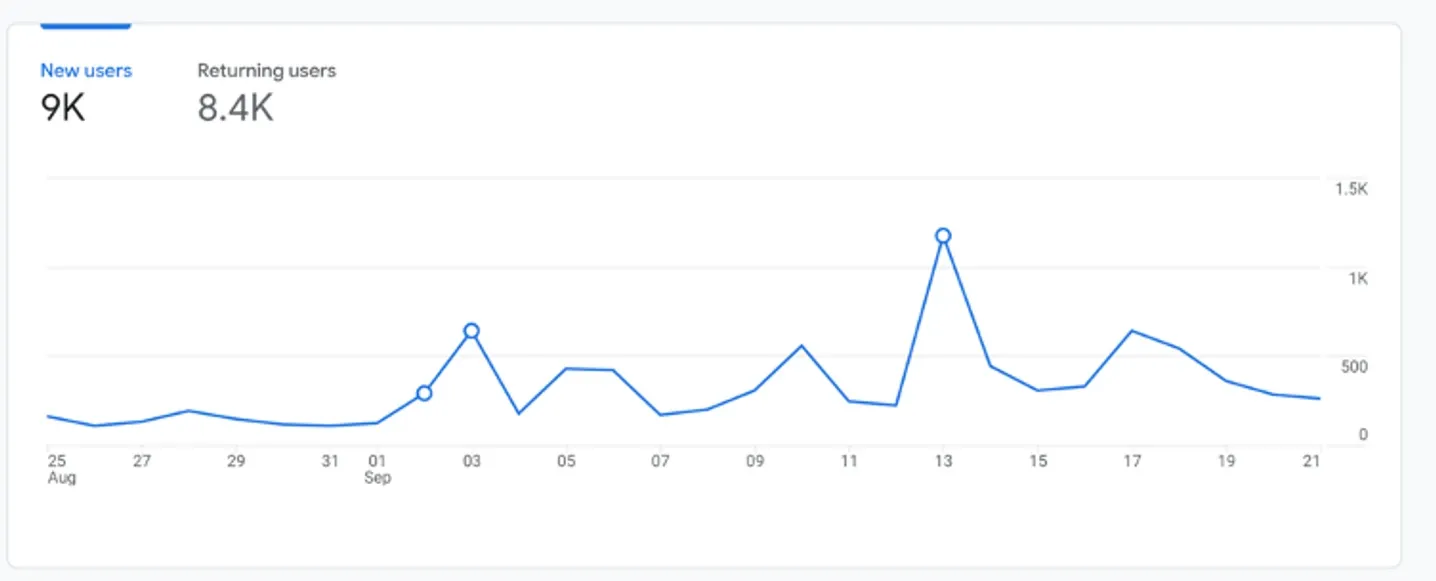
Users and sessions are essential too: they show how many of those who installed the app and opened it for the first time actually use it.
Long story short, this section gives you an overview of all Google Ads campaigns running, so you can compare them and see the ones performing best for your applications. Statistics shown here are not as detailed as those in Google Ads itself, yet it gives you a nice quick overview.
Retention
Another interesting tab to look at is Retention. It shows how many of your users open your application again within a certain period. The higher this score, the better: more users that tried your app would like to use it at least once again.
However, the numbers here don’t tell you enough about the real situation. Try checking User retention in %.
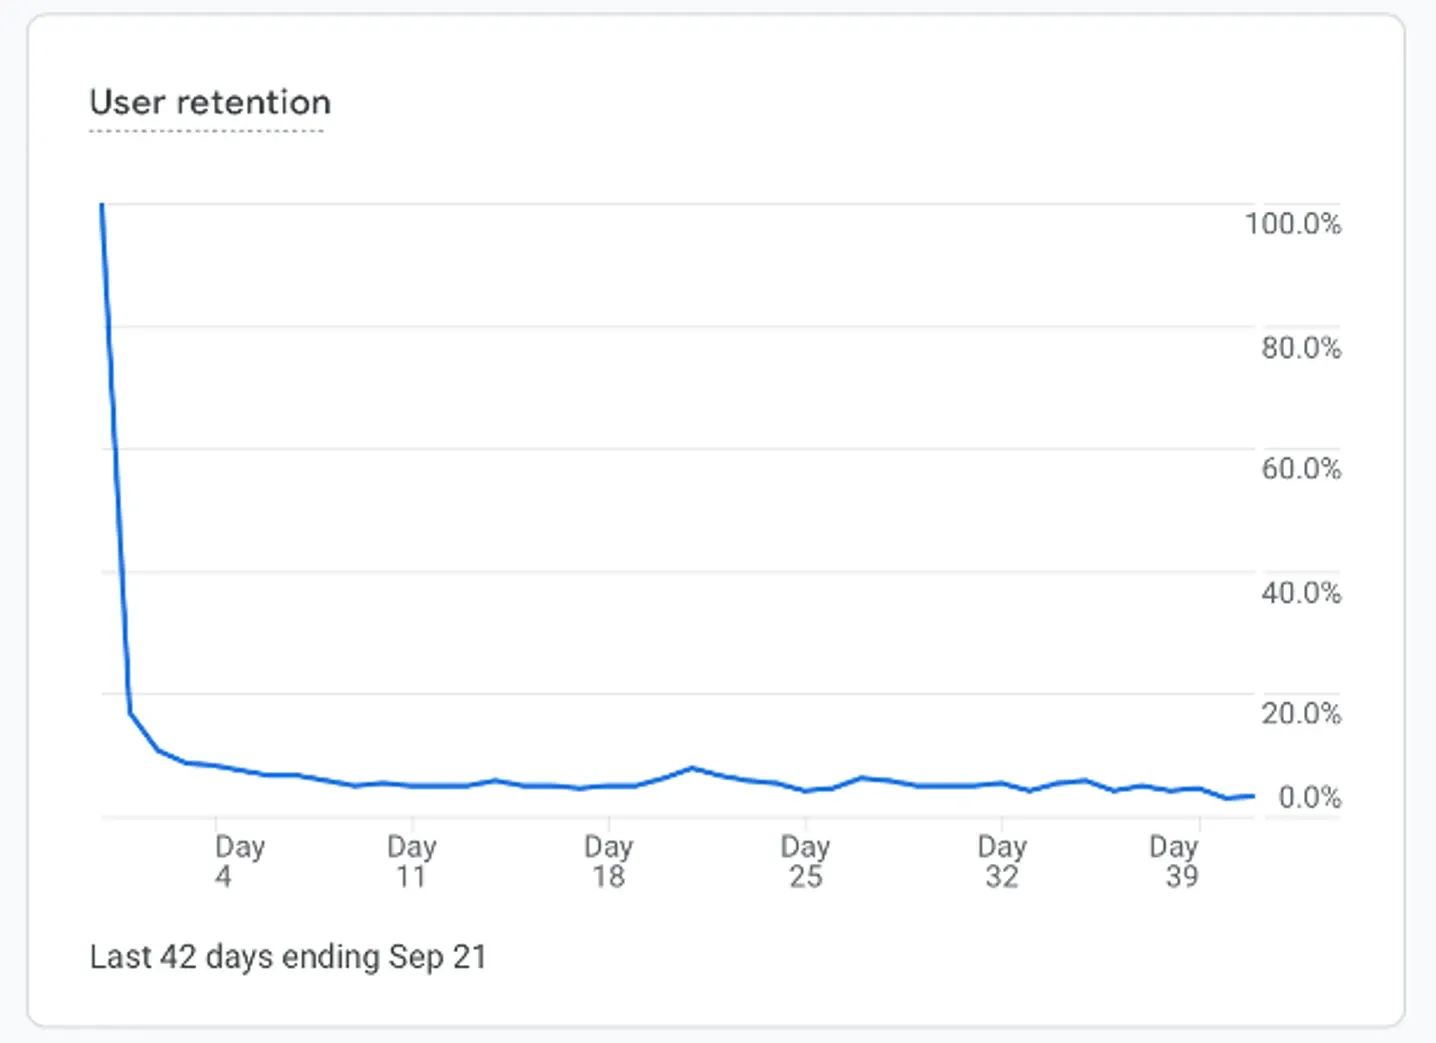
What’s a good score here? The answer differs per industry. It’s absolutely great if, in two months, your retention rate is about 15% (which is really hard to achieve). 5% is a good enough score for a ride-hailing business.
Engagement
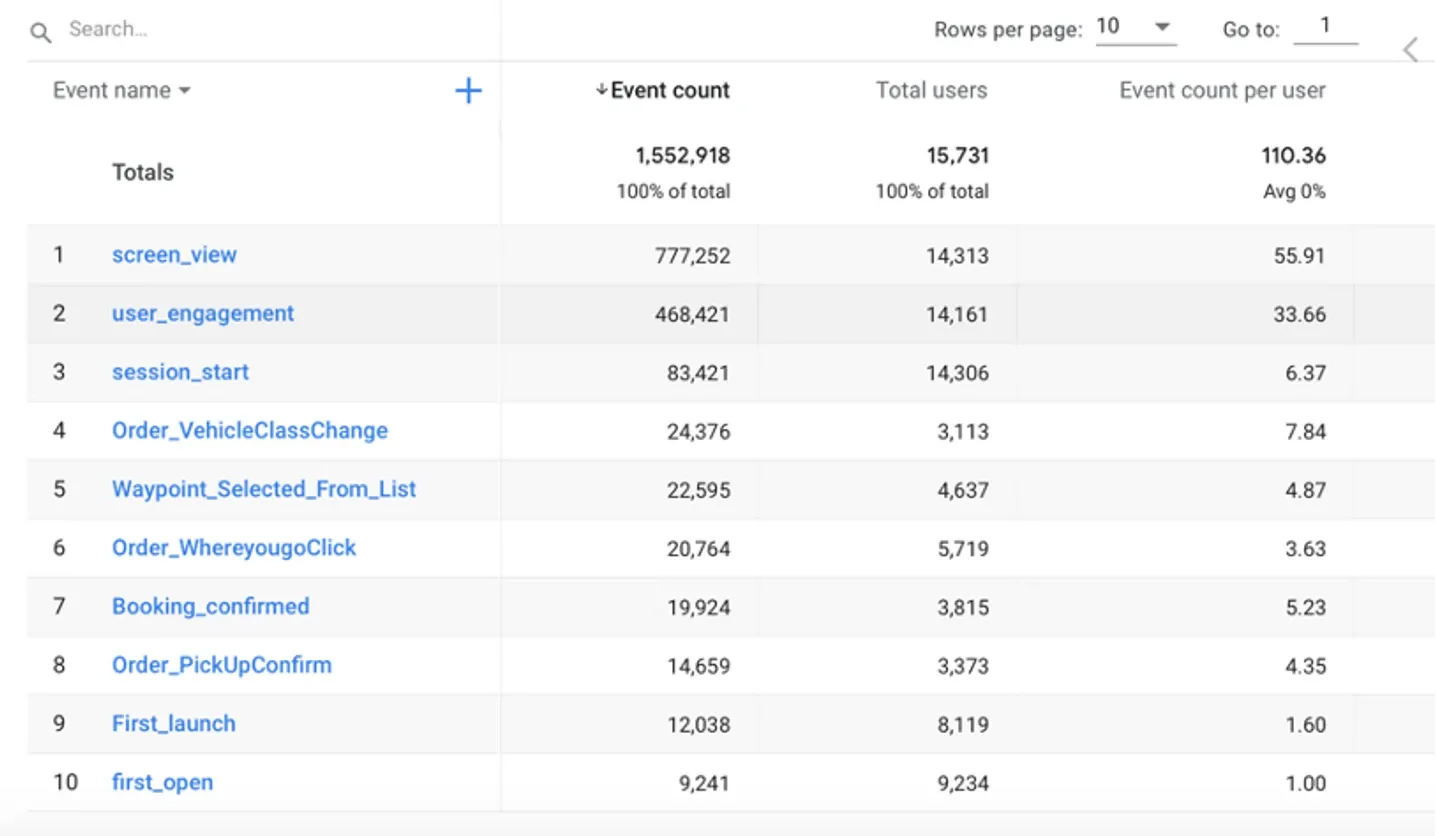
The Engagement overview will give you an idea about user engagement within your app. It’s connected to their actions (events and conversions) and screens they see—so literally everything a user can do in your app.
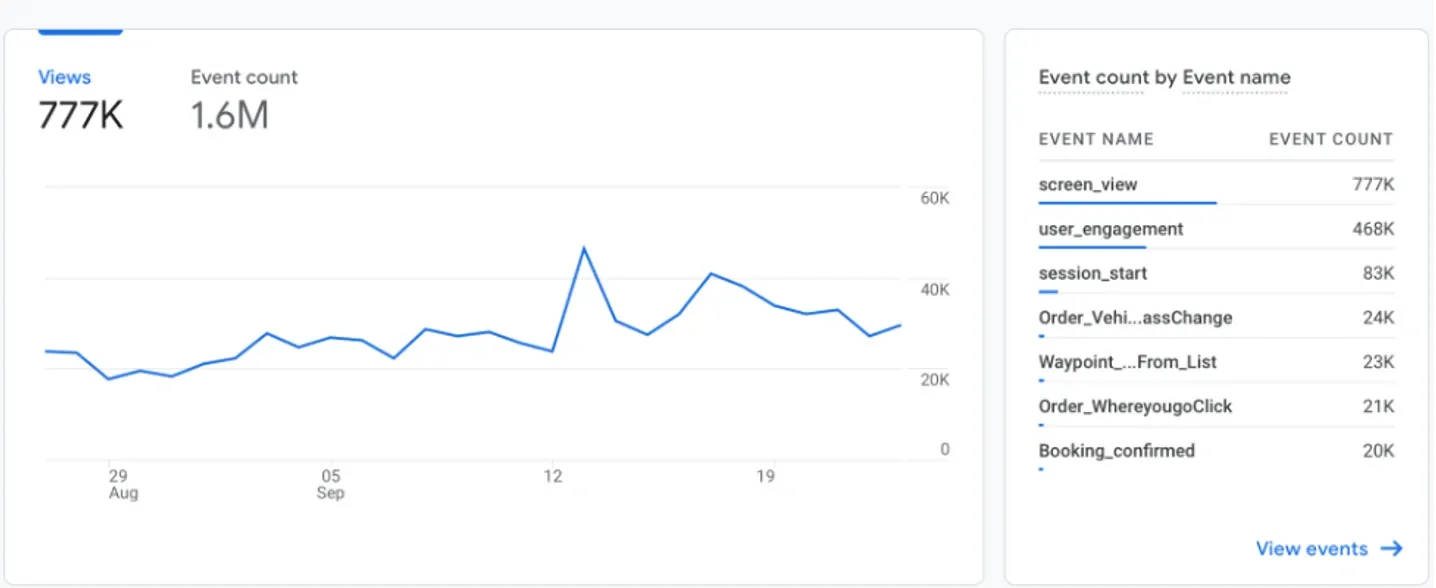
We’ve already discussed conversions, but the events metric is no less important. It shows all the actions users do in the app. In the picture above, you can see the screen_view event (how many screens within the app a user saw, like the main screen of the app, the screen of adding a credit card to an account, a screen of the order, etc.). There are other events, too: session_start (each time when the user opens the app), Booking_confirmed (when the customer’s order is confirmed), and more.
When you go to the Events tab, you can see all the events connected to your applications.
One more tab to visit in the Engagement section is Pages and Screens.
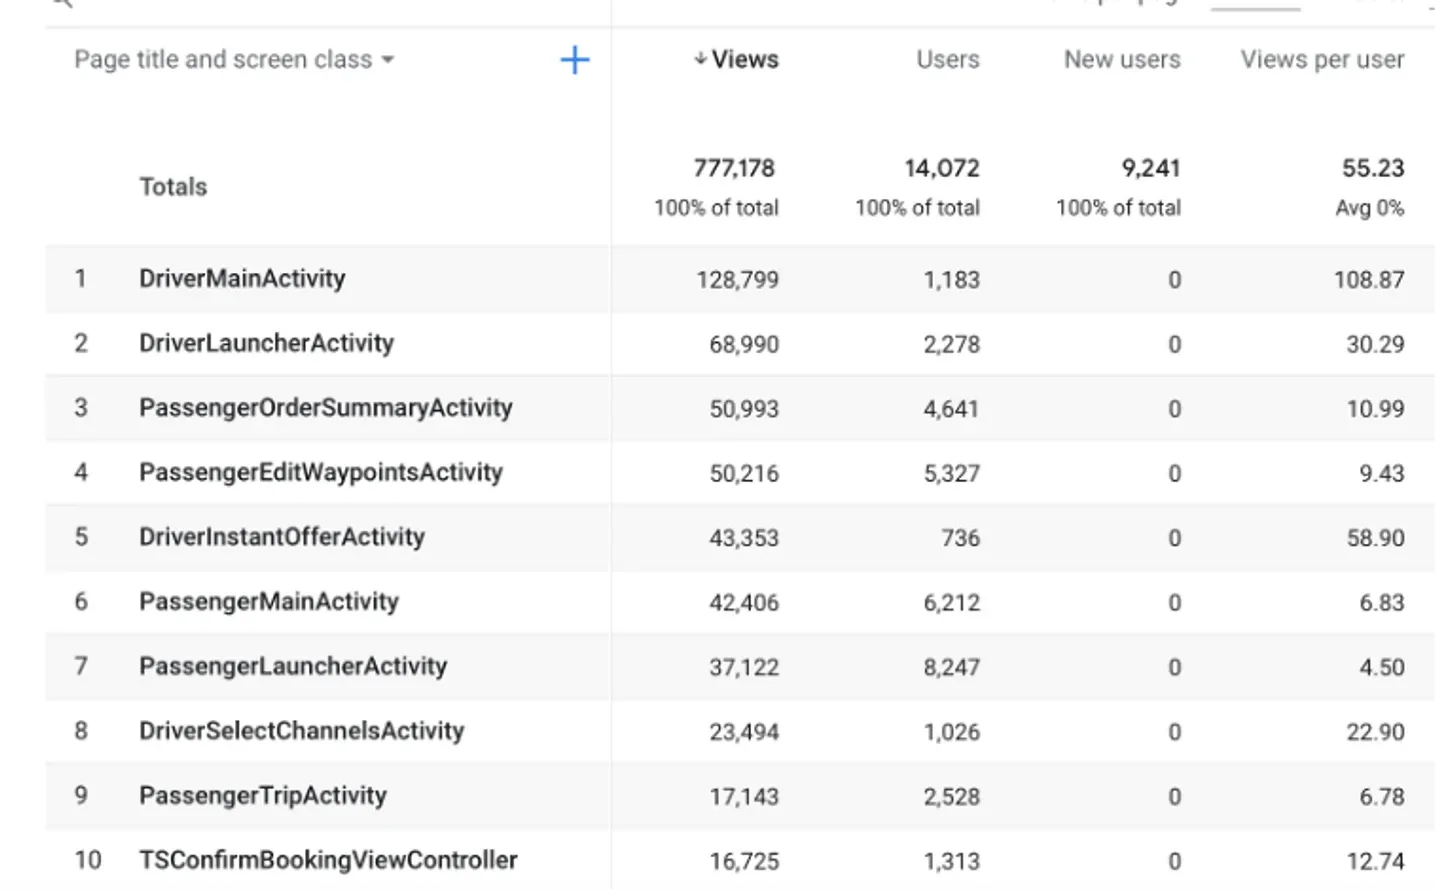
In this tab, you can view all the different screens your users (including drivers) use in the application. How’s that helpful? Well, for example, you might find out that many users initiate an order but never really finish one. Knowing this helps you understand that the prices are too high or there are not enough drivers.
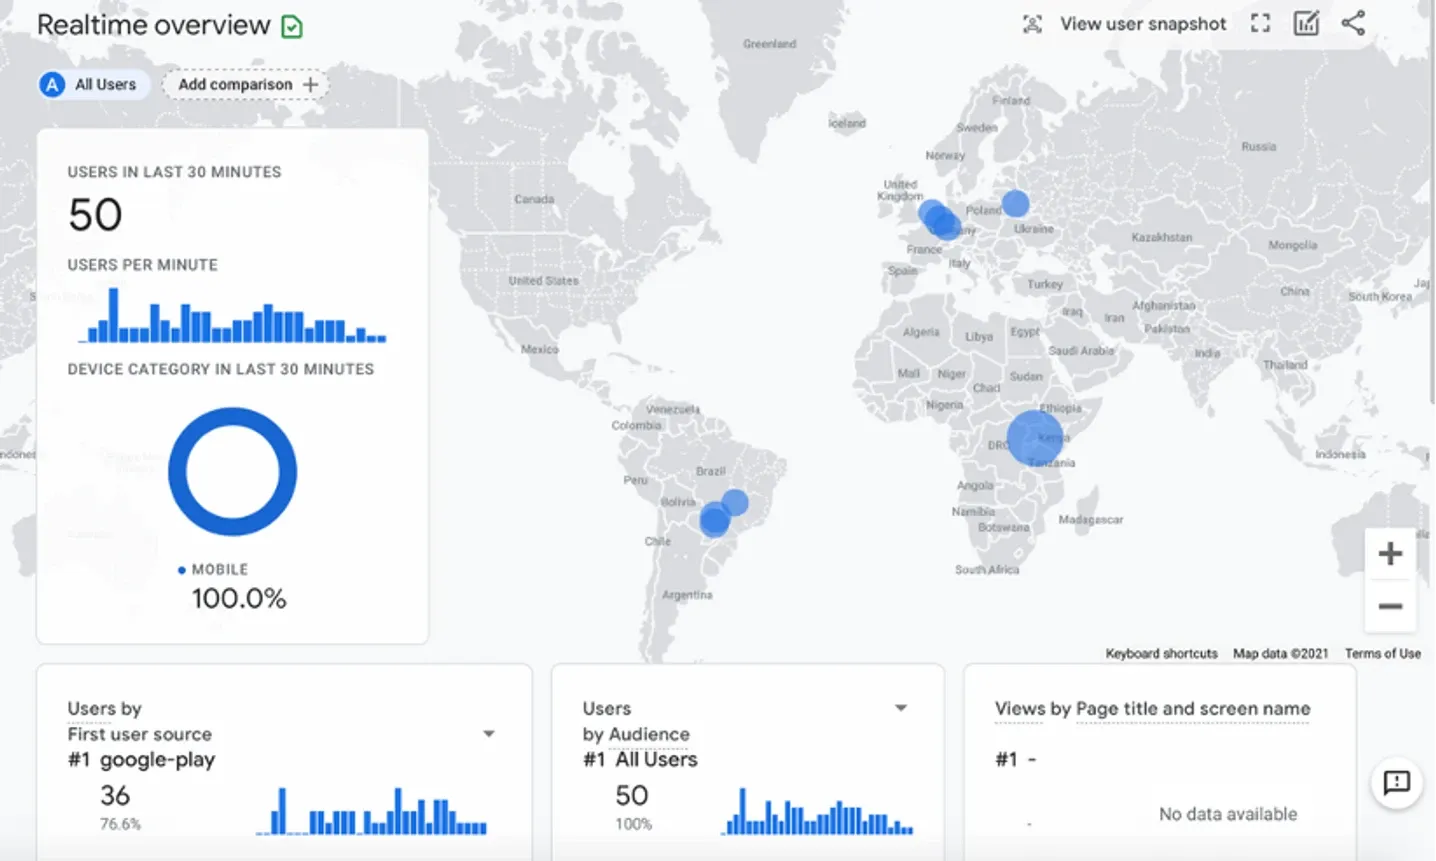
Realtime
Realtime is the very first tab you see in Google Analytics. It shows all the users, their interaction with the app, their demographics almost in real-time. It’s not very helpful in terms of analysis, but it will give you some ideas about where your app is used right now, whether it’s active, and what the users are actually doing (viewing the app or ordering a ride).
Google Analytics for ride-hailing apps: wrap-up
Google Analytics is a powerful tool giving you insights for making the right decisions and reviewing the results of your business.
With Google Analytics, you get various reports and graphs you can use to make your company even more successful. Now that Facebook Analytics isn’t available anymore, you can work with Google Analytics to target and market better, get insights about your users and how they interact with your application.
For sure, there are many more features in Google Analytics helpful for understanding the behavior of your users—so stay tuned. We’ll keep you posted!
Like the article? Share it with your friends!
Related posts
-
 Do you know what makes companies successful in this world? Experience of the founder? Well, yes. Initial investments? Hmm, in some cases. Marketing strategy? Definitely. However, whatever success factors you consider, please remember that analytics is the basis.
Google Analytics basics for ride-hailing companies. Part 1
-
 Ride-hailing services being provided via an app — it seems as if they’ve been there forever. Uber, Gett, Juno, you name it — great companies making transportation move forward to the future, very literally.
Must-have features for ride-hailing
-
 App uninstalls can steal 70% of your users. Their financial impact is too sad to mention. Here’s why app uninstalls happen and how to get rid of them once and for all!
70% users uninstall your app? Hack this!